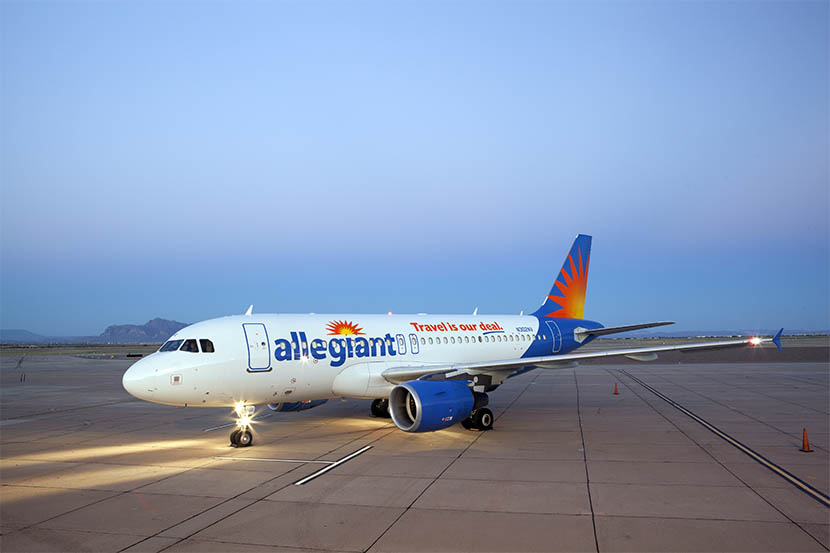
Allegiant unveils preliminary February 2024 traffic stats, revealing insights on passenger trends

Allegiant Travel Company (NASDAQ: ALGT) unveiled its initial passenger traffic data for February 2024.
“First quarter demand continued the trend of outperformance during peak weeks offset by a normalized off-peak demand profile,” stated Drew Wells, Allegiant chief revenue officer. “Unitized revenue during the last two weeks of March exceeded prior year, highlighting continued demand strength. First quarter TRASM will come in slightly lower than initial expectations, up roughly .5 percent sequentially from the fourth quarter of 2023. This is predominantly due to a slightly weaker than expected lead up to the Spring Break period. While we communicated the shift of Spring Breaks to the back half of the month, results were softer than we anticipated in those few lead up weeks. Second quarter capacity considers this normalization with April capacity down 10 percent year over year, accounting for the Easter shift forward. Additionally, June aircraft utilization is currently on par with 2018 levels to optimize capacity during our seasonally strong summer peaks. Early bookings into June, coupled with peak demand trends observed during the first quarter, suggest continued demand strength into peak summer travel periods.”
Here’s a breakdown of the year-over-year performance:
Scheduled Service Metrics (February 2024 vs. February 2023):
- Passenger Count: Increased slightly to 1,243,576 from 1,242,555, showing a growth of 0.1%.
- Revenue Passenger Miles (RPMs): Saw a modest rise to 1,194,104,000 from 1,189,402,000, marking a 0.4% increase.
- Available Seat Miles (ASMs): Grew by 2.1% to 1,421,672,000 from 1,393,065,000.
- Load Factor: Experienced a slight decrease from 85.4% to 84.0%, dropping by 1.4 percentage points.
- Departures: Marginally increased to 8,556 from 8,537, a 0.2% rise.
- Average Stage Length: Extended to 933 miles from 921 miles, an increase of 1.3%.
Total System Performance (February 2024 vs. February 2023):
(Note: Total system includes scheduled service and fixed fee contract.)
- Passenger Count: Rose to 1,253,860 from 1,250,293, up by 0.3%.
- Available Seat Miles (ASMs): Increased to 1,456,189,000 from 1,424,778,000, a 2.2% growth.
- Departures: Went up to 8,846 from 8,775, showing a 0.8% increase.
- Average Stage Length: Increased slightly to 924 miles from 916 miles, a 0.9% rise.
It’s important to note that the total system metrics include both scheduled services and fixed fee contracts. Metrics such as system revenue passenger miles and system load factor are not provided as they are not applicable; the ASMs include both revenue-generating and non-revenue repositioning flights, with the latter serving operational needs. Fixed fee flying contributions are better evaluated financially rather than through operational statistics.
Preliminary Financial Results:
- The estimated average fuel cost per gallon for the system in February 2024 is $3.16.
Updated Quarterly Guidance:
- The estimated average fuel cost per gallon for the system in the first quarter of 2024 is projected to be $3.02.
The post Allegiant unveils preliminary February 2024 traffic stats, revealing insights on passenger trends appeared first on Travel And Tour World.
Source link
Leave a Reply Cancel reply
- Trending
- Comments
- Latest
TTMiles
Travel with me and experience each trip as a magical chapter in my travelogues. Come along with me as we discover the marvels of the globe one engrossing tale at a time.
Read more
Categories
Recent News
ALL, WBA, DAL, WBD and more
© 2024 Trilliontravelmiles - The one stope travel news site by Trilliontravelmiles.


